ARCH_Pred server
Information
ARCH_Pred is a web application that interface a knowledge-based loop structure prediction method described in this publication. Given a query loop of unknown structure, ARCH_Pred identifies the most suitable loops from a library of structures of protein loops. The prediction algorithm shown below include 3 major steps: Selection, Filtering and Ranking.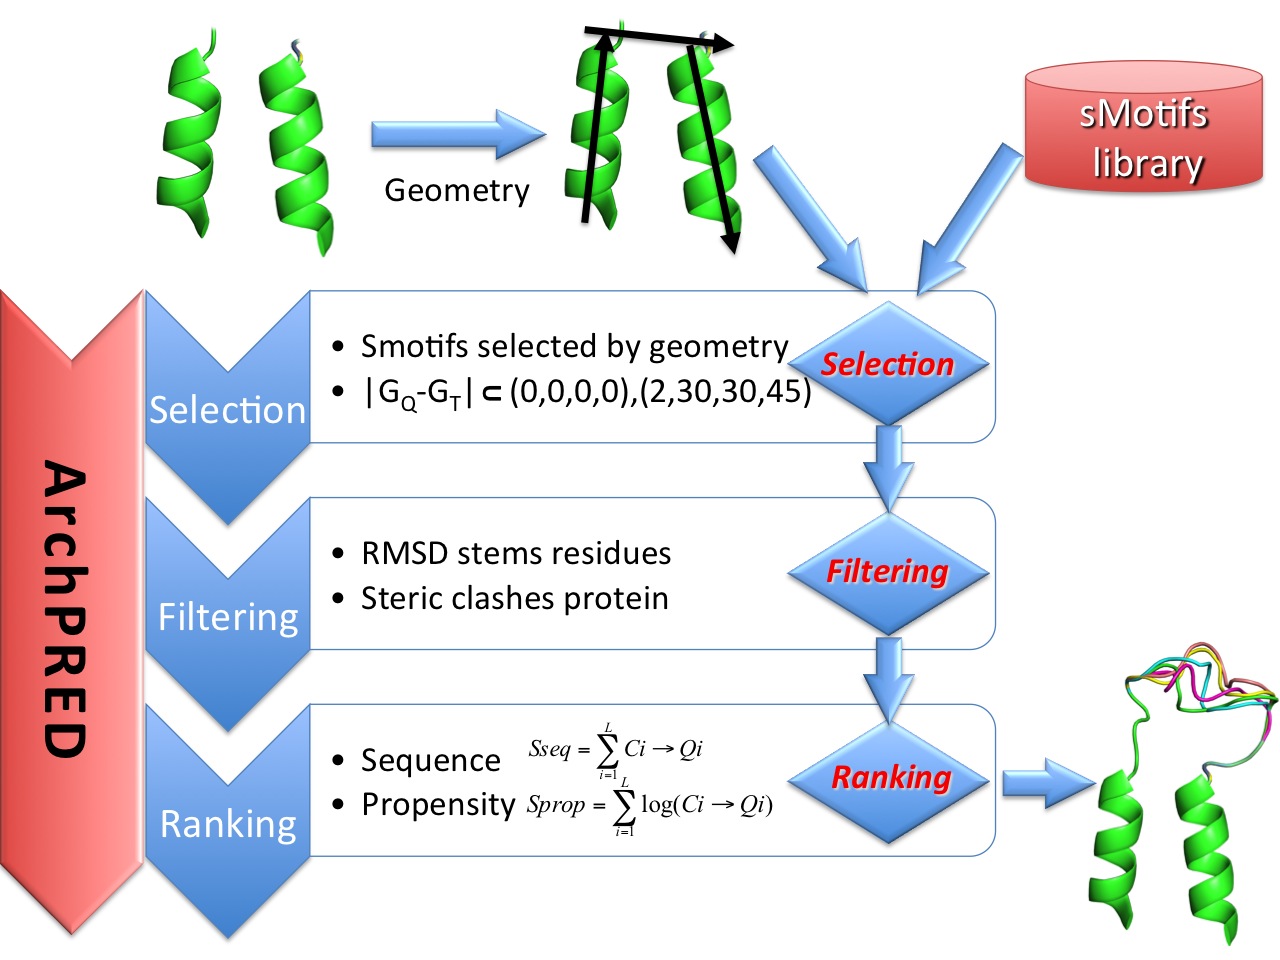
Selection
In this step, the geometry of the unknown loop region is used to query a large database of sMotifs extracted from protein structures. Smotifs will qualify if the the different in geometry between query and target falls within the semi-open interval [(0,0,0,0)-(2,30,30,45)], i.e. two loops: loop A and B with geometry GA=(DA,δA,θA, σA and GB=(DB,δB,θB,σB) share the same geometry if the difference in geometry falls inside the semi-open interval [(0,0,0,0),(2,30,30,45)).Two loopsFiltering
The smotifs selected in the previous steps undergo a filtering step based on two criteria: (i) RMSD of stem residues, i.e. residues that flank missing loop (ii) Steric clases with protein The filtering step in the algorithm discards clearly unfavorable candidates by assessing the fit of stem regions and by steric fitting in the new protein framework. The terms of steric violations or clashes are computed among main chain atoms (N, C, Cα and O). Two atoms are in steric clash if their distance is smaller than the 70% of sum of the respective van der Waals radii.Ranking
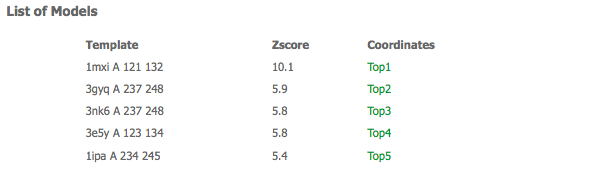
The final step is the ranking of the remaining candidate loops. The ranking is based on a composite function that takes into account sequence and structural information in the form of main-chain phi/psi angle propensities. The sequence similarity score is calculate using the conformation similarity weight matrix described here The propensity score measures the compatibility of observed and expected dihedral angles of each residue of the candidate loop in the corresponding position of the query. Main chain conformation definitions and propensities are defined according to the p15 propensities table described here. Sequence and propensity scores are combined and normalized by computing Zscores.Submission form
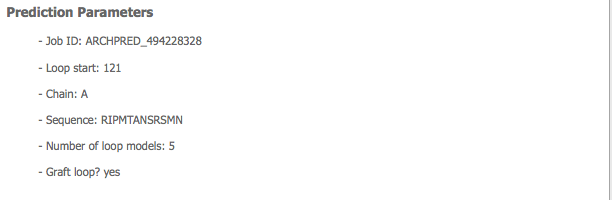
Prediction parameters
The first section of the submission form allow users to upload the coordinates of the protein structure containing the missing loop(s). The atomic coordinates must be on standard PDB format. Users have to define the starting residue of the missing loop and the chain ID.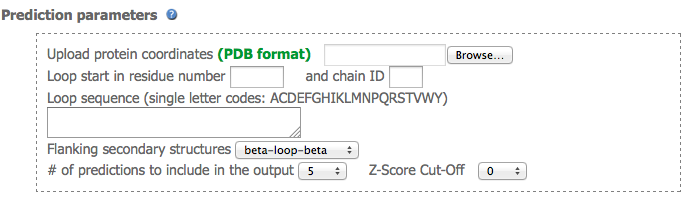
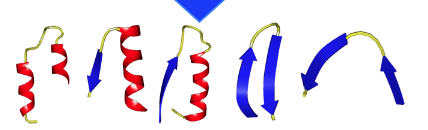
From left to rigth: alpha-loop-alpha; alpha-loop-beta; beta-loop-alpha; beta-loop-beta (hairpin); beta-loop-beta (link). Note that both hairpins and links are considered beta-loop-beta motifs.
Finally, users select the number of loop structure to be returned by the prediction (10 maximum) and the Z-score cut off.IMPORTANT The numbering of the uploaded coordinates must be consistent and in agreeement with the missing loop. For instance, if predicting a missing loop of length 14 and the loop stars at residue 17 and chain A, then the PDB file should look like this:
...
ATOM    826  N   PHE A  14      49.206  19.282  50.320  1.00 54.69           N
ATOM    827  CA  PHE A  14      48.606  19.107  51.603  1.00 55.79           C
ATOM    828  C   PHE A  14      47.836  17.809  51.723  1.00 56.22           C
ATOM    829  O   PHE A  14      48.078  17.051  52.638  1.00 55.30           O
ATOM    830  CB  PHE A  14      47.690  20.257  51.882  1.00 56.82           C
ATOM    837  N   LEU A  15      46.893  17.551  50.827  1.00 57.29           N
ATOM    838  CA  LEU A  15      46.182  16.280  50.875  1.00 59.26           C
ATOM    839  C   LEU A  15      47.047  15.013  50.740  1.00 59.98           C
ATOM    840  O   LEU A  15      46.727  13.971  51.280  1.00 60.70           O
ATOM    845  N   GLU A  16      48.121  15.088  49.997  1.00 60.70           N
ATOM    846  CA  GLU A  16      48.980  13.935  49.837  1.00 61.99           C
ATOM    847  C   GLU A  16      49.482  13.456  51.186  1.00 62.42           C
ATOM    848  O   GLU A  16      49.617  12.256  51.424  1.00 62.45           O
ATOM    946  N   VAL A  31      25.144  19.607  51.305  1.00 51.18           N
ATOM    947  CA  VAL A  31      25.010  20.708  52.246  1.00 52.08           C
ATOM    948  C   VAL A  31      23.603  20.835  52.761  1.00 52.94           C
ATOM    949  O   VAL A  31      22.705  21.156  52.037  1.00 54.54           O
ATOM    953  N   THR A  32      23.403  20.559  54.023  1.00 54.13           N
ATOM    954  CA  THR A  32      22.075  20.604  54.610  1.00 55.49           C
ATOM    955  C   THR A  32      21.767  21.988  55.149  1.00 56.13           C
ATOM    956  O   THR A  32      20.606  22.329  55.356  1.00 56.55           O
...
If the numbering is not consistent, coordinates will be deleted when the PDB file is parsed
Post-prediction optimization
ARCH_Pred allow the post-prediction optimization of predicted loops. This includes the grafting of the loop in the the protein structure and the refinement using modeller. In this case, the server returns individual protein structures with grafted loops. If unchecked, the server will return the coordinates of the protein and the candidates loops in a NMR style PDB file where MODEL 1 is the frame protein and the candidate loops structures (main chain traces) MODEL 2 and above.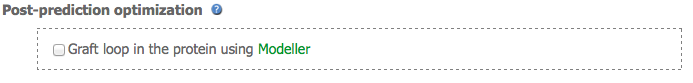
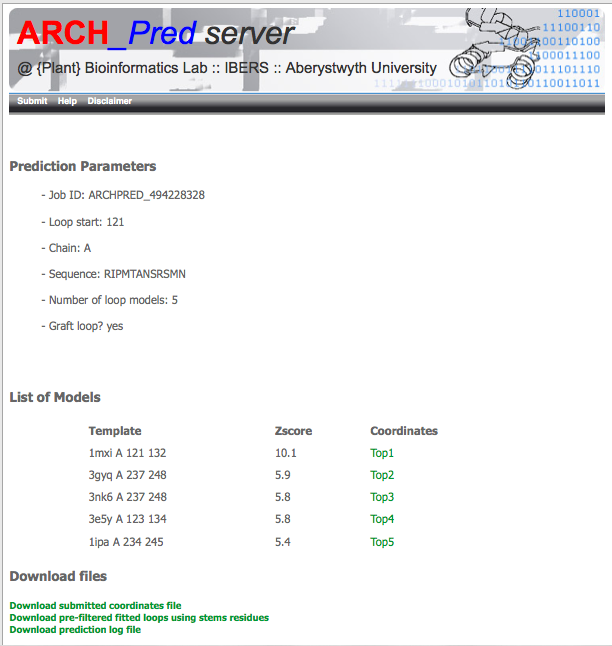
Results web page
If the prediction is sucessful the web server will return an web page similar to the one shown below. Should an error occur during the prediction, the web page will show an specific error message and a link to the prediction log file available to download for inspection