PCRPi Webserver
INFORMATION and HELP
GENERAL INFORMATION:
PCRPi is a method for predicting critical residues (i.e. hot spot residues) in protein interfaces. PCRPi relies on the integration of seven measures or variables that account for energy, structural and evolutionary information by using Bayesian Networks. Figure 1 shows an overall description of the prediction process.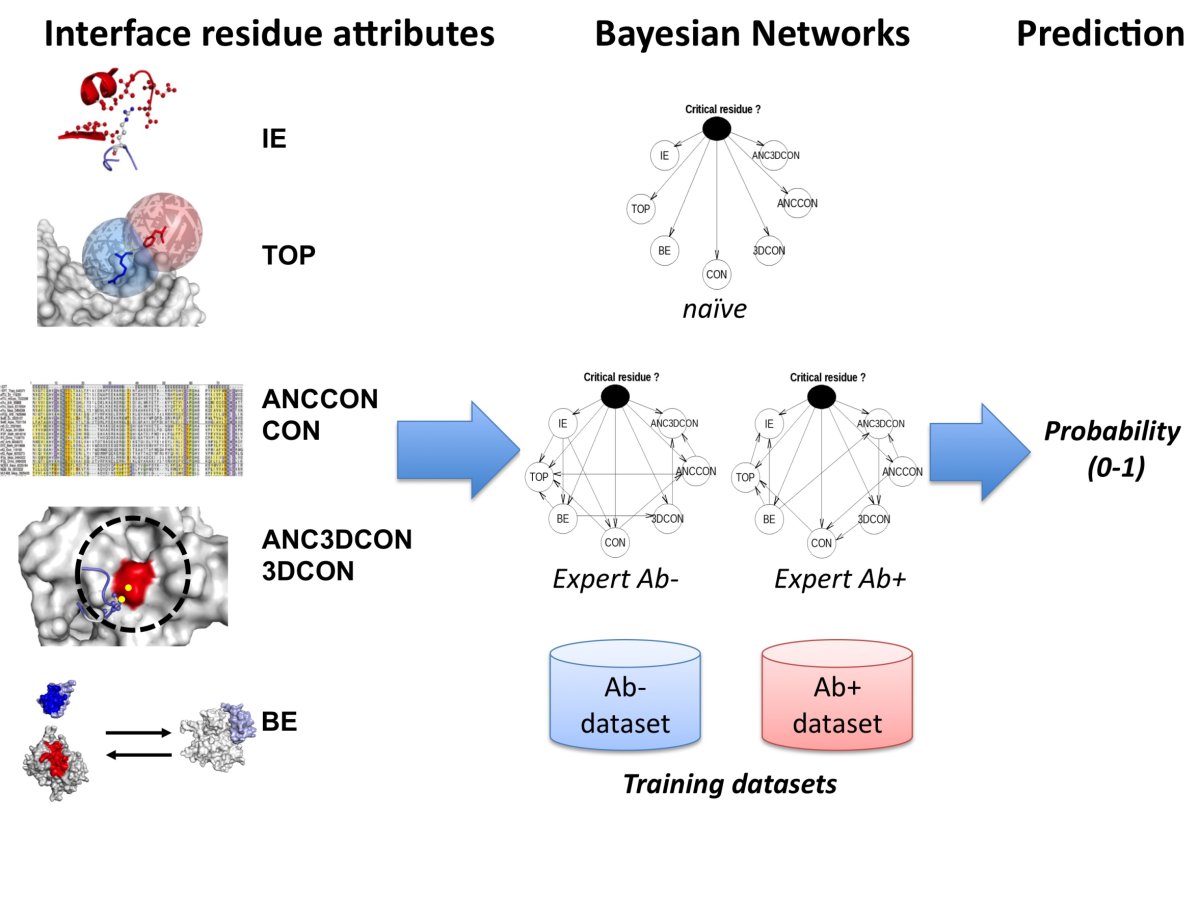
Figure 1. Overall description of the prediction process (click here to enlarge the figure).
Interface residue attributes:
-
1. Interaction engagement index (IE). The IE index gauges the proportion of side chain atoms (including the main-chain amino
nitrogen and carboxyl oxygen) of a given interface residue that are engaged on atomic interactions with proteins in the complex.
Non-bonded atomic interactions are described using CSU program [1]
2. Topographical index (TOP). The TOP index estimates the structural micro-environment of a given interface residue and is calculated as the ratio between structurally neighbor residues and the average number of residues that the given residue type (e.g. Ala) interact with when located on a protein interface. Structurally neighbor residues are any residues not belonging to the same chain whose carbon alpha is enclosed in a sphere of 10 Angstroms of radius centered on the carbon alpha of the given residue. The average number of contacts by residue type is shown in table 1.
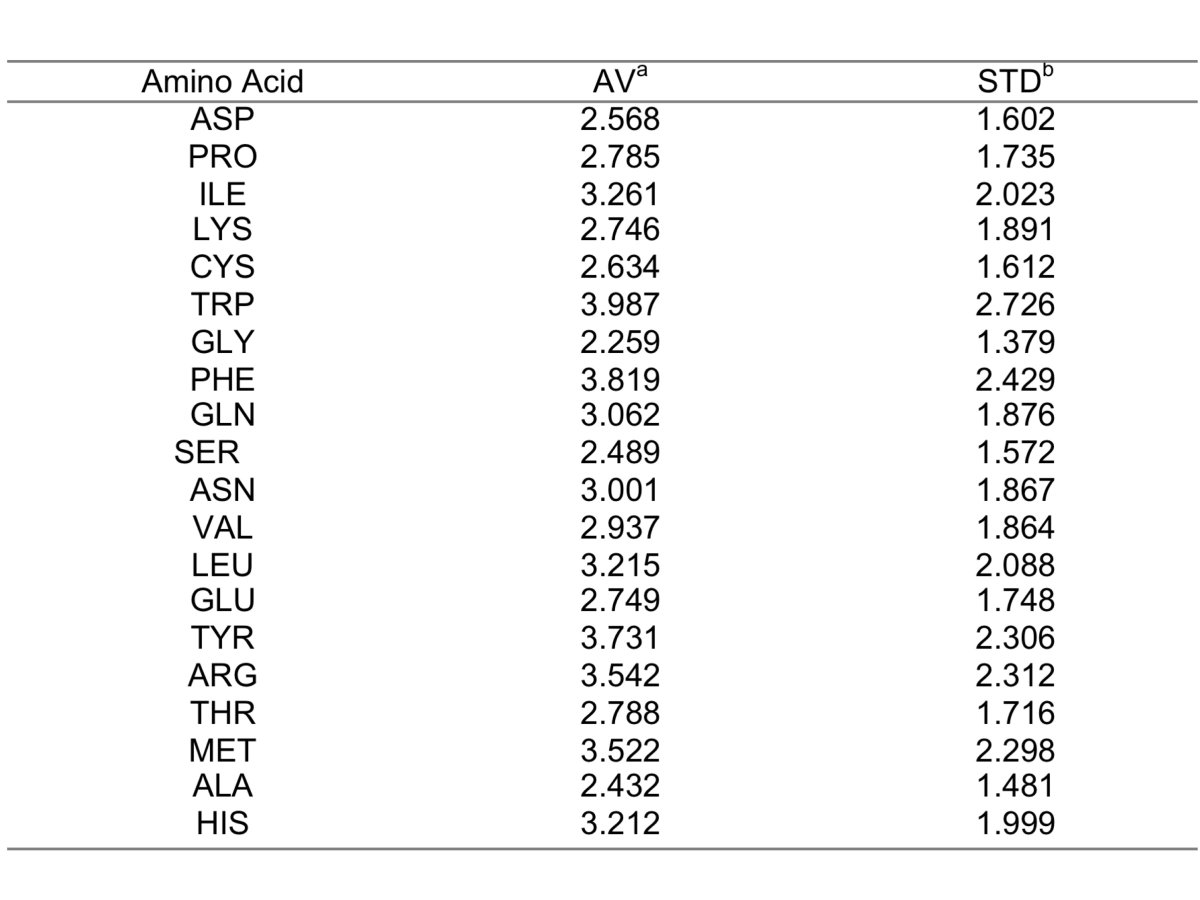
Table 1. (a) Average; (b) Standard deviation (click here to enlarge the table).
3. CON index. The CON index refers to the evolutionary conservation of residues that are in contact with a given interface residue. To analyze the conservation, sequence profiles are derived as described in our previous work [2]. In short, homologous sequences are culled from NR database of NCBI [3] using five iterations of PSI-BLAST [4] with an E-value of 0.0001. The homologous sequences are then filtered using ParseBlast [5] with default parameters to maximize the sequence sampling avoiding bias toward overrepresented protein families. The resulting sequence profile are given to al2co program [6] as an input and the al2co sequence conservation score is assigned to each individual residue. Finally, for a given interface residue i, the CON index is the ration between residues with an al2co_score greater or equal to 1.0 and the total number of residues in contact with residue i.
4. ANCCON index. The ANCCON index refers to the raw al2co[6] sequence conservation score applied to each individual interface residue.
5. 3DCON index. The 3DCON index is equivalent to the CON index but the al2co sequence conservation score is substituted by the 3D regional conservation scores as defined by Landgrad et al.[7], therefore this index quantifies structurally conserved patches.
6. ANC3DCON index. The ANC3DCON index is equivalent to the ANCCON index but using the 3D regional conservation score as conservation measure.
7. BE index. the BE index is equivalent to an in silico Alanine scanning. Each interface residue is mutated to Alanine and the effect of such mutation in the stability of the protein complex is estimated using FoldX[8]. Crystallographic waters, if any, are kept during the energy calculations. Therefore, BE reflects the difference in binding free energy between the unmutated (wild-type) and mutated complex.
-
Each interface residue is characterized by 7 different measures (shown above) that are expressed in different units. In order to unify
them into a common probabilistic framework, Bayesian Networks (BN).
are employed. Three different Bayesian Networks architectures are used by the prediction method: (i) naïve; (ii) an Ab+ specific
expert BN; and (iii) and Ab- specific expert BN (see Figure 1).
-
Experimentally validated data extracted from the AseDB,
and the BID databases, and Kortemme and Baker’s [9]
and Guerois et al.’s [8] works was compiled to generate the training datasets. Briefly, residues in protein
complexes were labeled as critical or non-critical depending on effect of point mutations (Alanine scanning) on the stability of the protein complexes. If the mutation was
increasing the binding energy in 2.0 Kcal.mol-1 or more the residue was annotated as critical or hot-spot residue, otherwise it was
considered as non-critical. This information is used to train the BNs.
Two different types of training set are considered: Ab+ and Ab- datasets. Ab+ is effectively the entire dataset (25 protein complexes, 636 interface residues, 300 of them experimentally annotated). Ab- dataset does not include non-evolutionary related protein complexes, i.e. Antigen-Antibody complexes. The reason of having two training datasets: Ab+ and Ab- is because some of the metrics used as input variables (ANCCON, ANC3DCON, CON, and 3DCON) rely on evolutionary information, i.e. sequence conservation, and in the case of (for instance) Antigen-Antibody complexes, this information is meaningless when referring to sequence conservation on CDRs (see Figure 1).
HOW TO USE THE SERVER?
PCRPi Webserver has a user friendly and simple interface. In order to use the server you only need to provide either:-
The PDB code of the protein complex of interest (e.g. 2uzi) or upload the coordinates of the protein complex (PDB format only!)
and provide the chain ID (as in the PDB file) of the protein in the complex that want to be analyzed. Alternatively, users can
select the type of Bayesian Network to be use (i.e. naive or expert and the dataset used to train the system (i.e. Ab+ or Ab- dataset),
see below ADVANCED PARAMETERS.
As a result, users will get a list of interface residues sorted by the probability of being critical for the interaction (i.e. higher probability would mean that the residue is indeed important in the interaction and likely to be part of the hot-spot of the interaction). Probabilities are mapped onto the protein structure by substituting the 'b-factor' field in the PDB file by the probability multiplied by 100. This provides and easy and convenient way to visualize the predictions in molecular viewers. A Jmol applet is also implemented, so users can visualize the structure of the protein complex and prediction in their own internet browser. Links are provided to any of the files that are generated during the prediction process allowing users to store all the information in their local computers. A successful prediction will generated the following files:
-
- Original PDB file (as in PDB Databank or as uploaded by users)
- Remediated PDB file (PDB file where quality checks have been perfomed (see below)
- B-factor substituted PDB file
- A file listing the atomic interactions at the interface or selected chain
- A file containing a list of predicted hot spot residues ranked by probability (plain text)
- A log file
ADVANCED PARAMETERS
By default PCRPi uses a naïve Bayesian network that is trained using protein complexes that includes non-evolutionary related complexes, e.g Antigen-Antibody (Ab+ dataset). On advanced options, the user can choose between naïve of expert Bayesian networks, and also the training dataset: Ab+ and Ab-. For more information, refer to the paper describing the method and to the general information shown above.
RETRIEVE YOUR PREDICTION
At the time of the submission an unique job identification code will be assigned to the task. The format of the job identification code is PCRPi_XXXXXXXX where XXXXXXXX is an unique string combination of letters and number. To retrieve the results or check the progress of the prediction process simply enter the full job identification code (including the PCRPi_ prefix) in the appropiate field at the submission web-site.
ERRORS DURING PREDICTION
There are some rare situations when PCRPi fails to deliver a prediction. The most common problem is when users submit (or select) a PDB containing a single chain or if more that one, there are no atomic interactions between chains. As PCRPi predicts critical residues on protein interfaces, the PDB *MUST* have at least two or more protein chains that are in contact (i.e. atomic interactions between residues in different chains). Also, keep in mind PCRPi filters protein chains by length; any chain shorter than 40 residues is discarded and not taken into consideration.
There are some other cases that will lead to problems and errors during the prediction process and are the following ones:
-
1. Fail during quality checks: A remediated PDB file is generated before running a prediction. The protein complex undergoes a set of quality checks that includes
checking for missing atoms, romaters, and inserted residues. Being energy methods very sensitive to the quality of the crystal structure and missing atoms,
this step is very important. If for some reason this step fails, the prediction process will stop.
2. Method fails to find sequence homologous. Psi-Blast do not yield any sequences with significant E-value, and as some of the measures are evolutionary-based and require the construction of a sequence profile, the prediction process will abort.
3. Other unlikely situations: Unable to connect to centralized DBs and/or queue system due to temporary network failure, machine shutdown, etc.
BENCHMARK and TRAINING SETS
-
The sets of structures used to train and benchmark PCRPi are available here.
RELATED RESOURCES
-
There are a number of related on line tools designed to predict hot spots in protein interfaces.
REFERENCES
-
[1] Sobolev, V., Sorokine, A., Prilusky, J., Abola, E.E. and Edelman, M. (1999) Automated analysis of interatomic contacts in proteins.
Bioinformatics, 15, 327-332. CSU server
[2] Fernandez-Fuentes, N., Rai, B.K., Madrid-Aliste, C.J., Fajardo, J.E. and Fiser, A. (2007) Comparative protein structure modeling by combining multiple templates and optimizing sequence-to-structure alignments. Bioinformatics, 23, 2558-2565. M4T server
[3] Pruitt, K.D., Tatusova, T. and Maglott, D.R. (2007) NCBI reference sequences (RefSeq): a curated non-redundant sequence database of genomes, transcripts and proteins. Nucleic Acids Res, 35, D61-65. NCBI web-site
[4] Altschul, S.F., Madden, T.L., Schaffer, A.A., Zhang, J., Zhang, Z., Miller, W. and Lipman, D.J. (1997) Gapped BLAST and PSI-BLAST: a new generation of protein database search programs. Nucleic Acids Res., 25, 3389. Psi-blast web-server @ EBI
[5] Rai, B.K., Madrid-Aliste, C.J., Fajardo, J.E. and Fiser, A. (2006) MMM: a sequence-to-structure alignment protocol. Bioinformatics, 22, 2691-2692. ParseBlast web-server
[6] Pei, J. and Grishin, N. (2001) AL2CO: calculation of positional conservation in a protein sequence alignment. Bioinformatics, 17, 700-712. al2co web-server
[7] Landgraf, R., Xenarios, I. and Eisenberg, D. (2001) Three-dimensional cluster analysis identifies interfaces and functional residue clusters in proteins. J.Mol.Biol., 307, 1487.
[8] Guerois, R., Nielsen, J.E. and Serrano, L. (2002) Predicting changes in the stability of proteins and protein complexes: a study of more than 1000 mutations. J Mol Biol, 320, 369-387. FoldX web-server
[9] Kortemme, T. and Baker, D. (2002) A simple physical model for binding energy hot spots in protein-protein complexes. Proc Natl Acad Sci U S A, 99, 14116-14121. Robetta-Ala web-server