- PDB structure: This is not a structural model but a complex determined by X-ray crystallography.
- Comparative: The structure of the complex was determined by comparative modelling (MODPIN)
- M4T – data driven docking: The structure of the complex was determined by first modelling the monomers individually using M4T and then docking them using V2DOCK.
- AF – data driven docking: The structure of the complex was determined by taking the structure of monomers from the AlphaFold2 database, parsing the low quality regions then docking them using V2DOCK.
Tutorial
Search the database
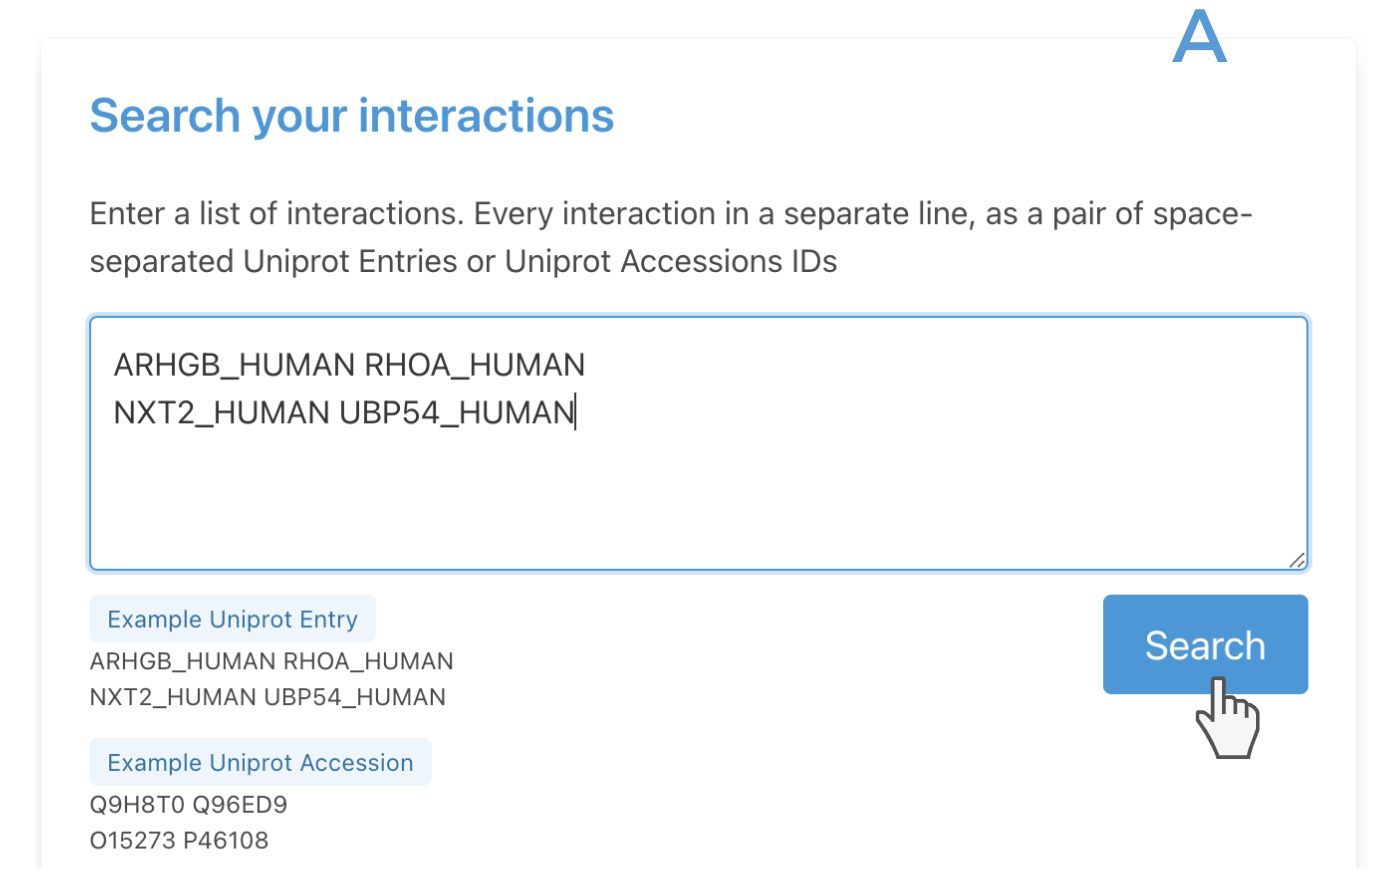
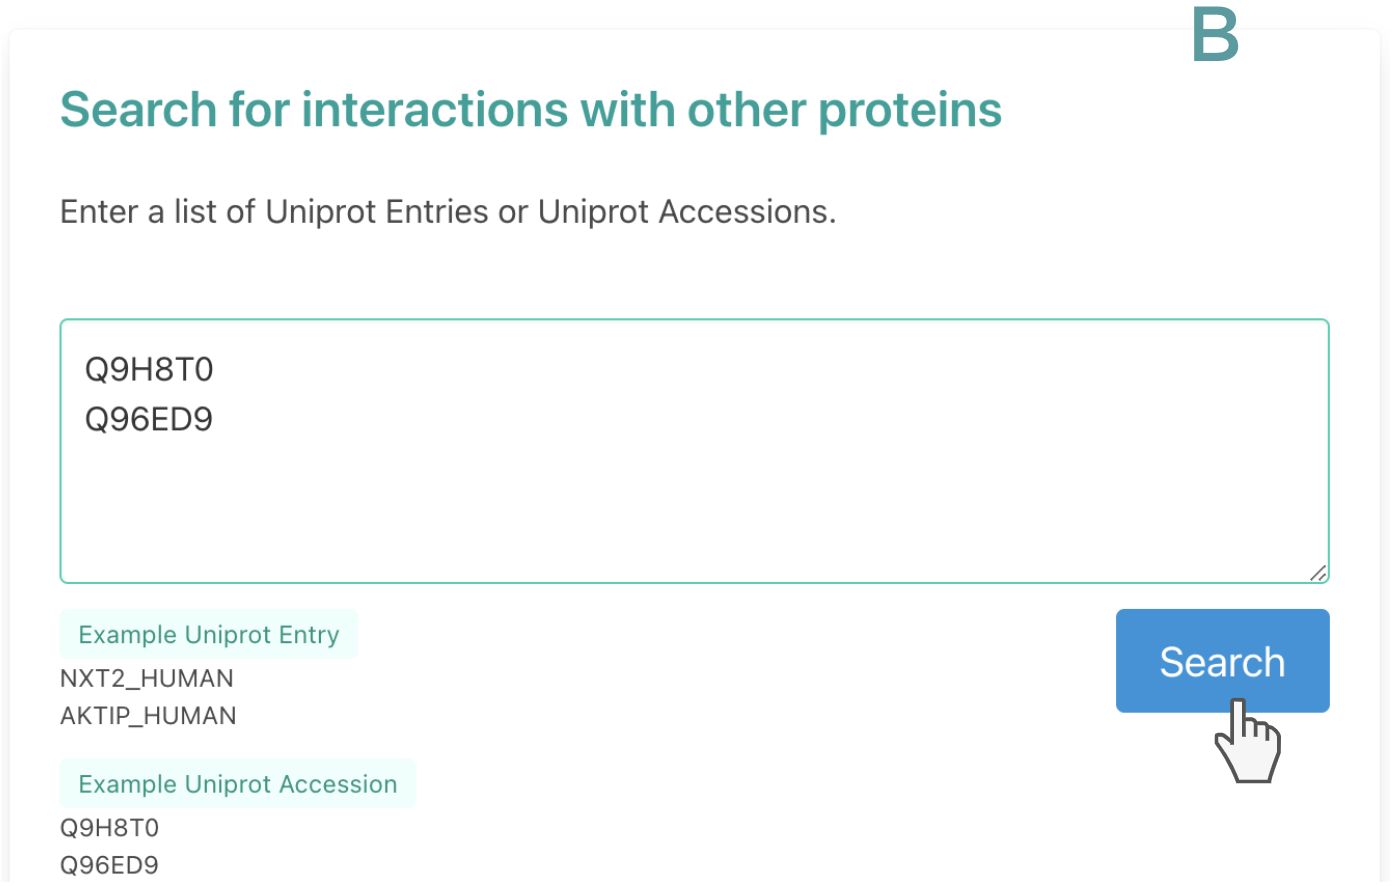
The search boxes at the top of the page accept queries based on Uniprot Entry (i.e LDB1_HUMAN) or UniProt accession (Q86U70). Users can submit a list of interactions, so pairs of interacting proteins (box A) or submit a list of proteins and look directly for interactions with proteins (box B).
Search results
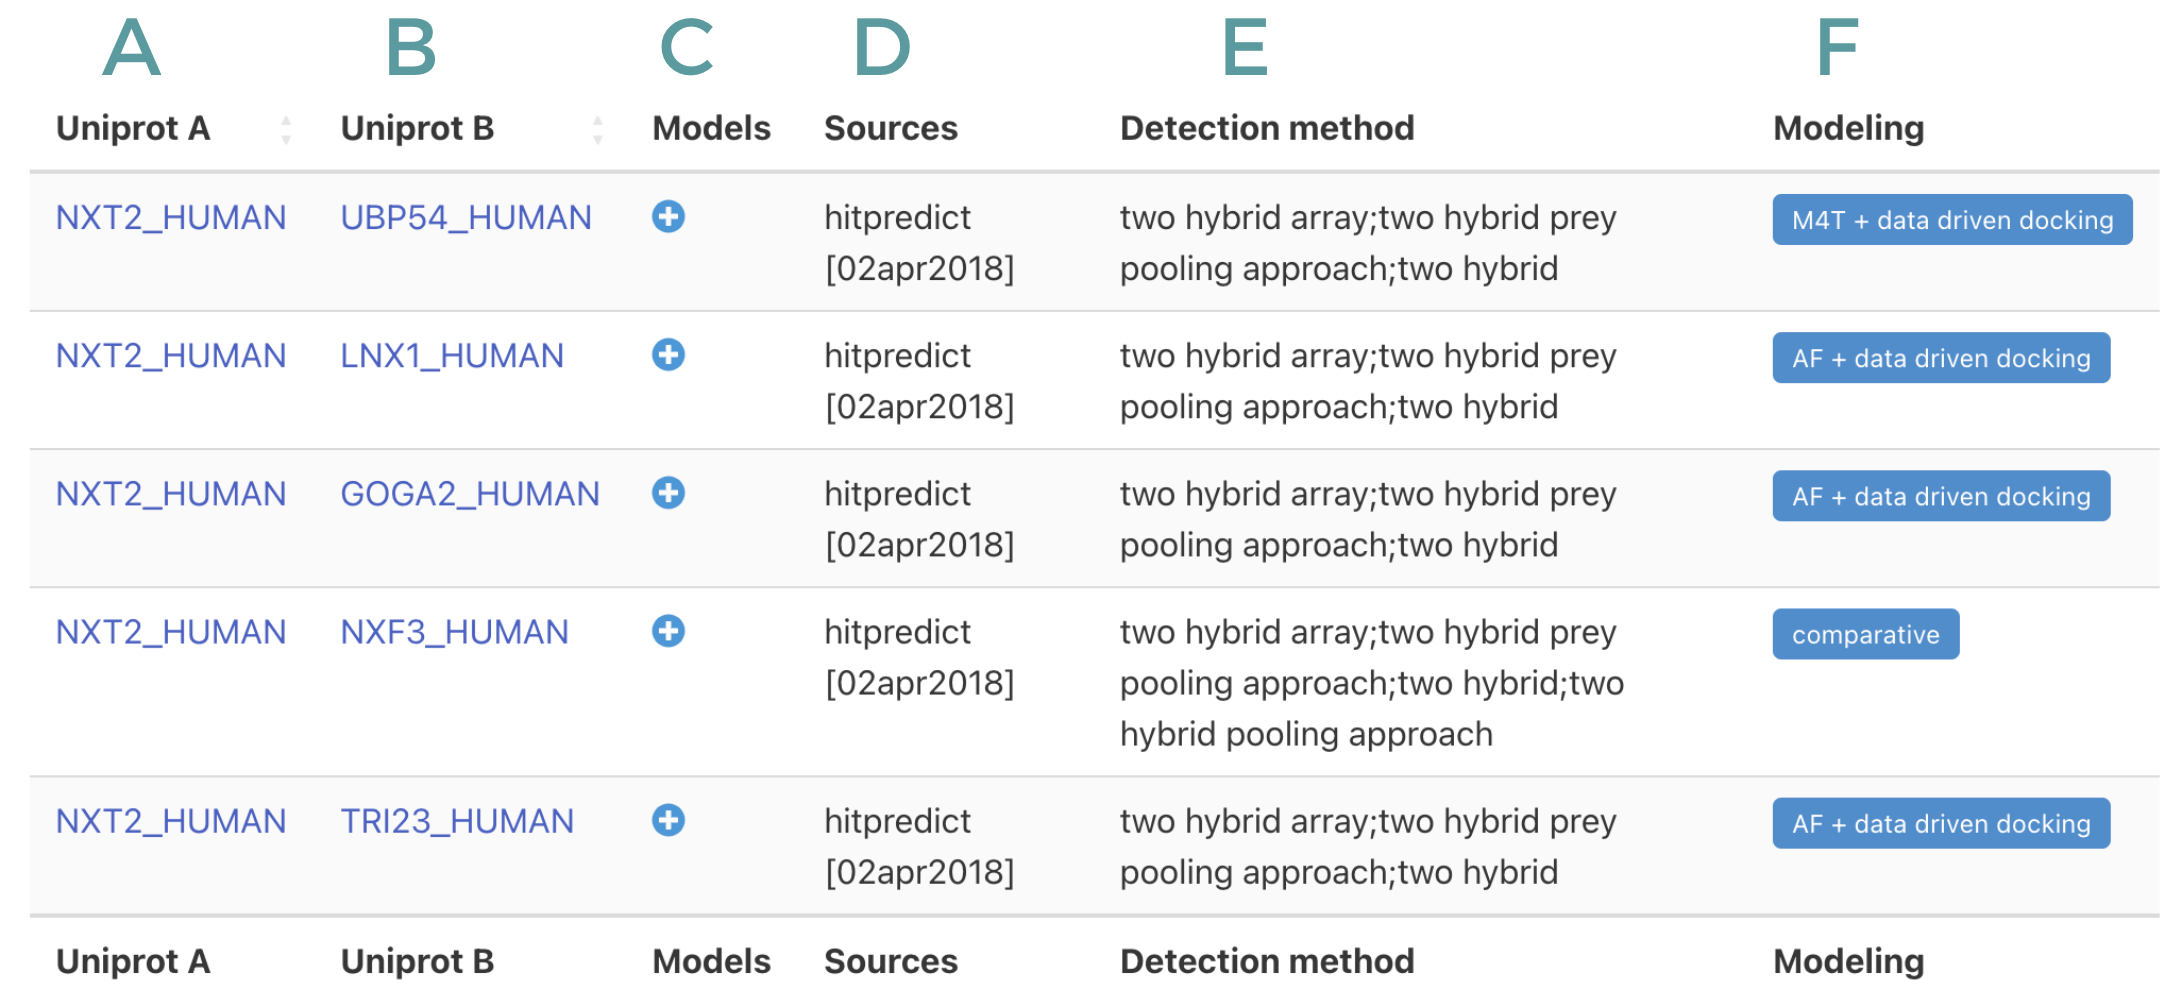
Upon query the database a table is returned with the information on the structural models of protein complex. The first two columns of the table: A and B, indicates de Uniprot ids of the given pairs. Column C will display a table with information of models (see next section) Column D indicates the database/s where the interaction of these two proteins is reports, together with column E, which indicates the experimental methods used to determine the given interactions. Finally, column E indicate the method used to derive the structural models.
The possible options on column F as follow:
Results Table
Upon clicking on the ‘+’ in column C as shown before a table containing the information of complexes will be displayed. The contents of the table depends on whether the structure was obtain by comparative modelling or docking.
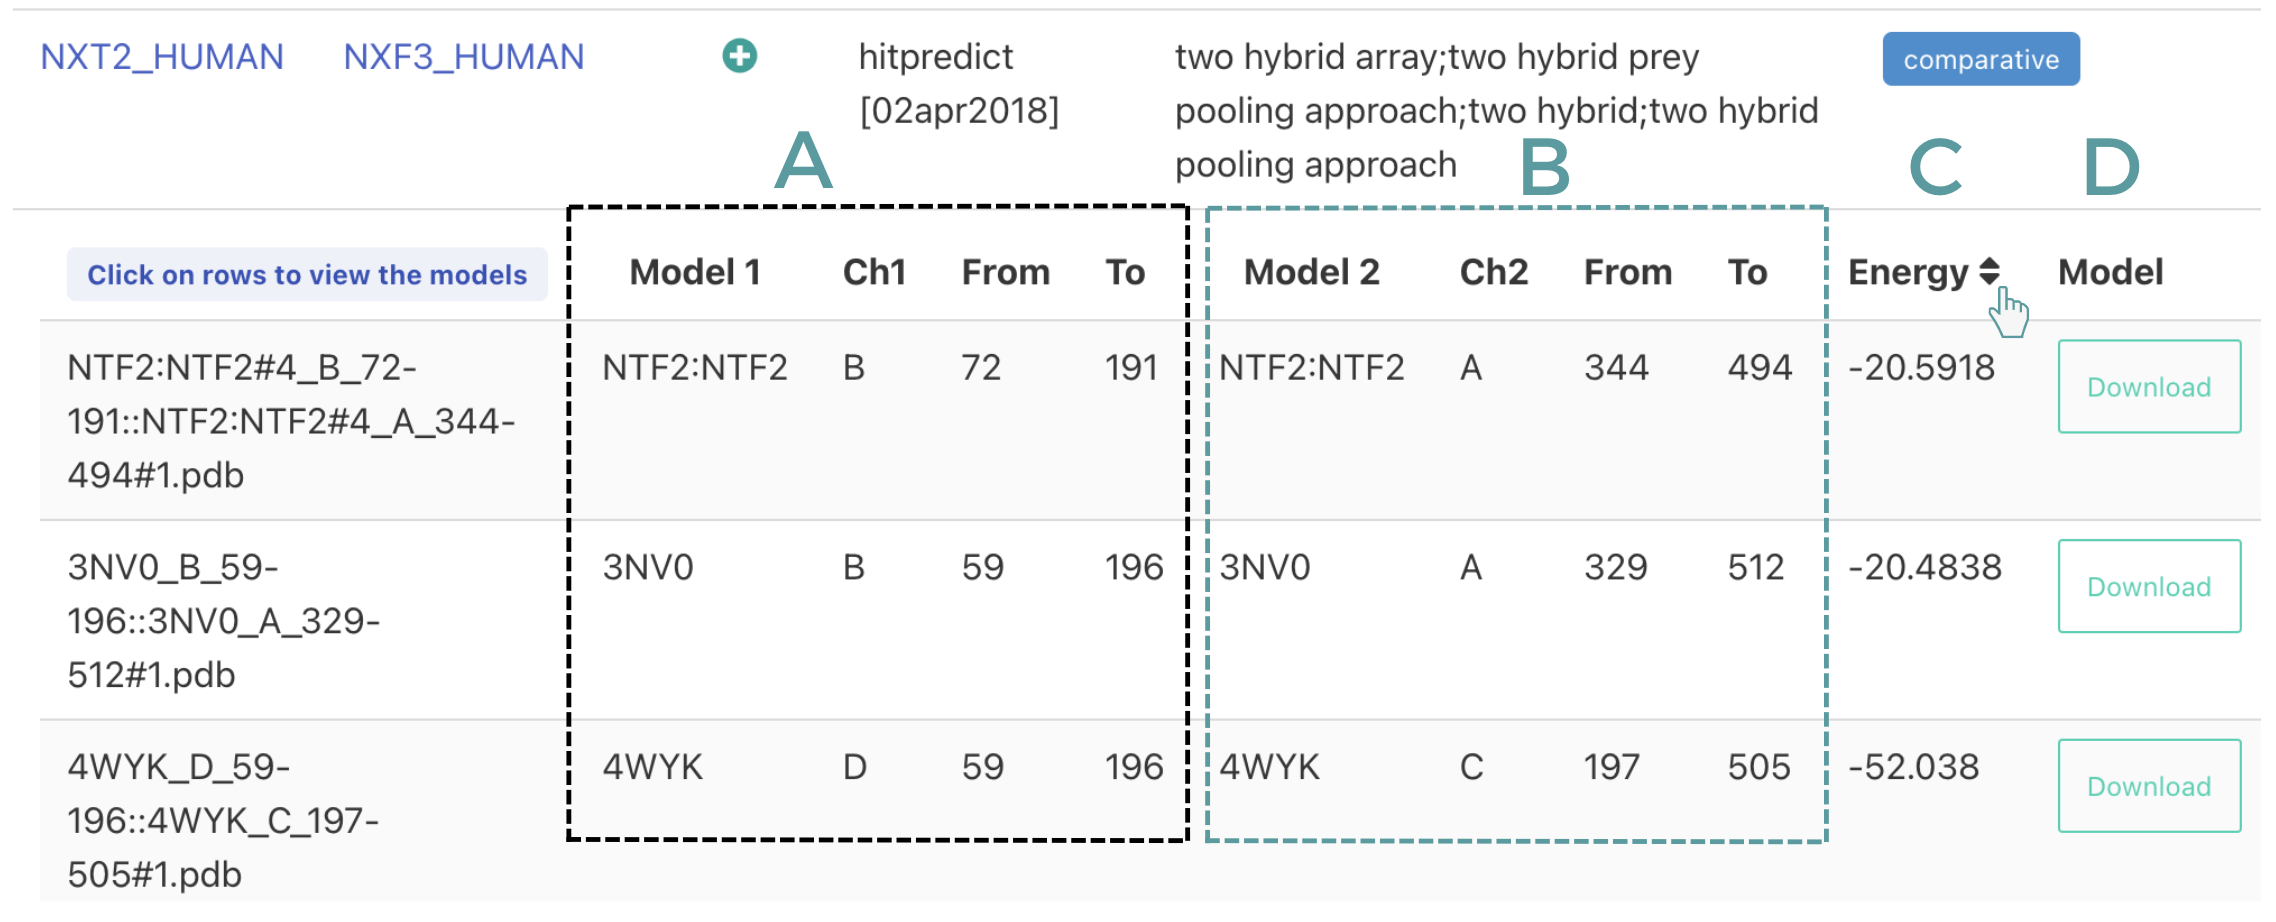
- Comparative modelling Information is presented in column A and B about the templates used to model the complex including the chain id and the region used. Column C reports the binding energy as calculated using FoldX, clicking on the arrows you can sort it both ascendingly or descendingly. Finally column D allows users to download the coordinates of the complex.
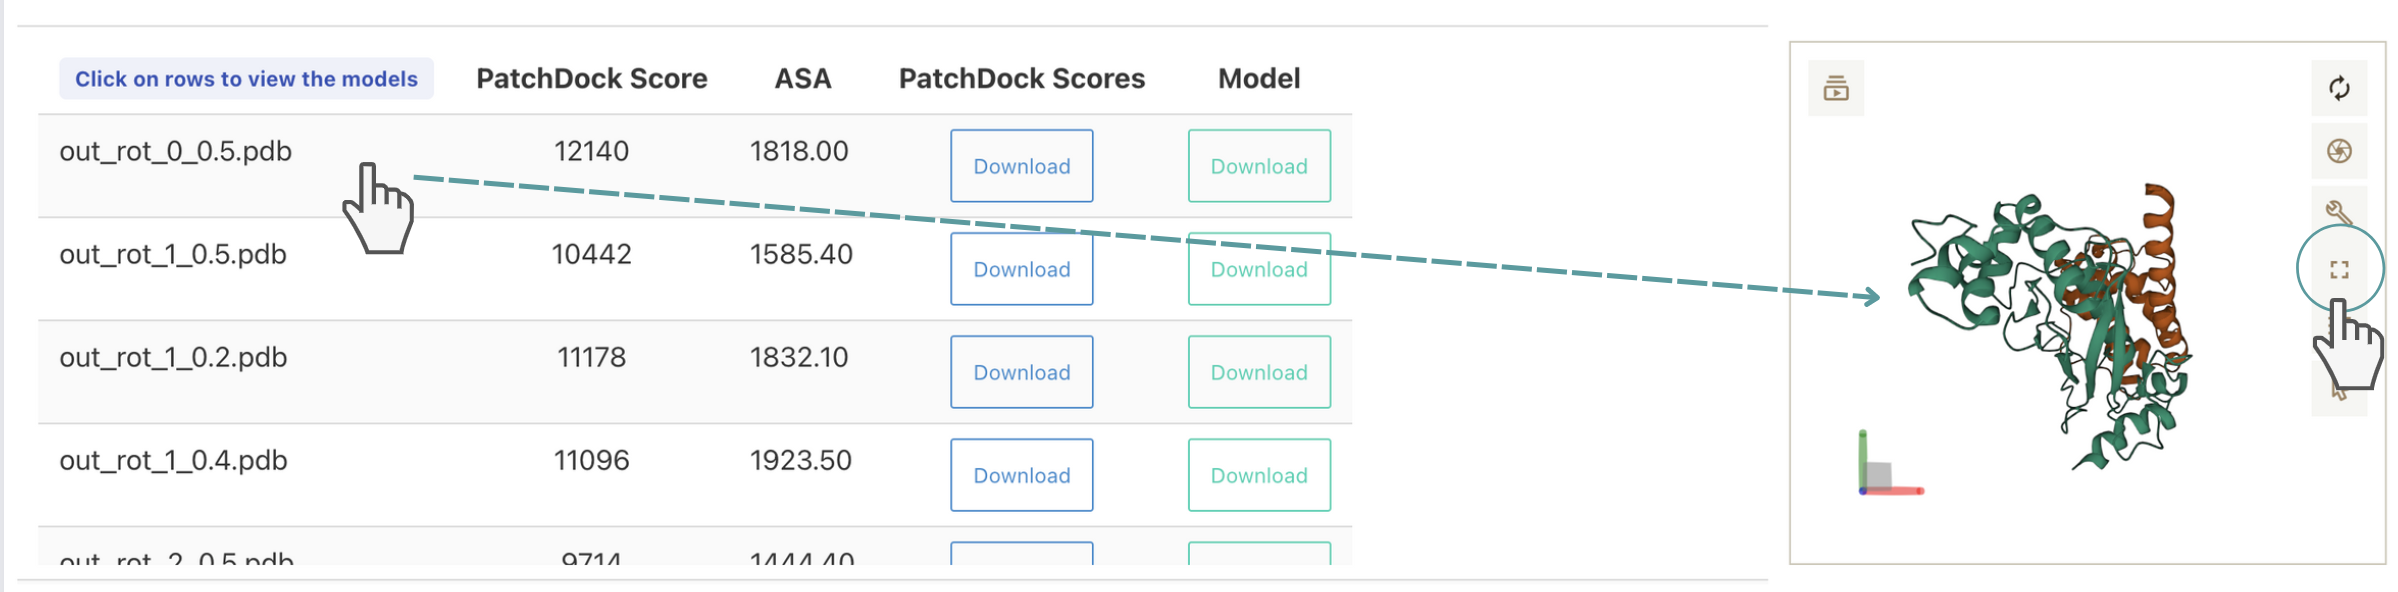
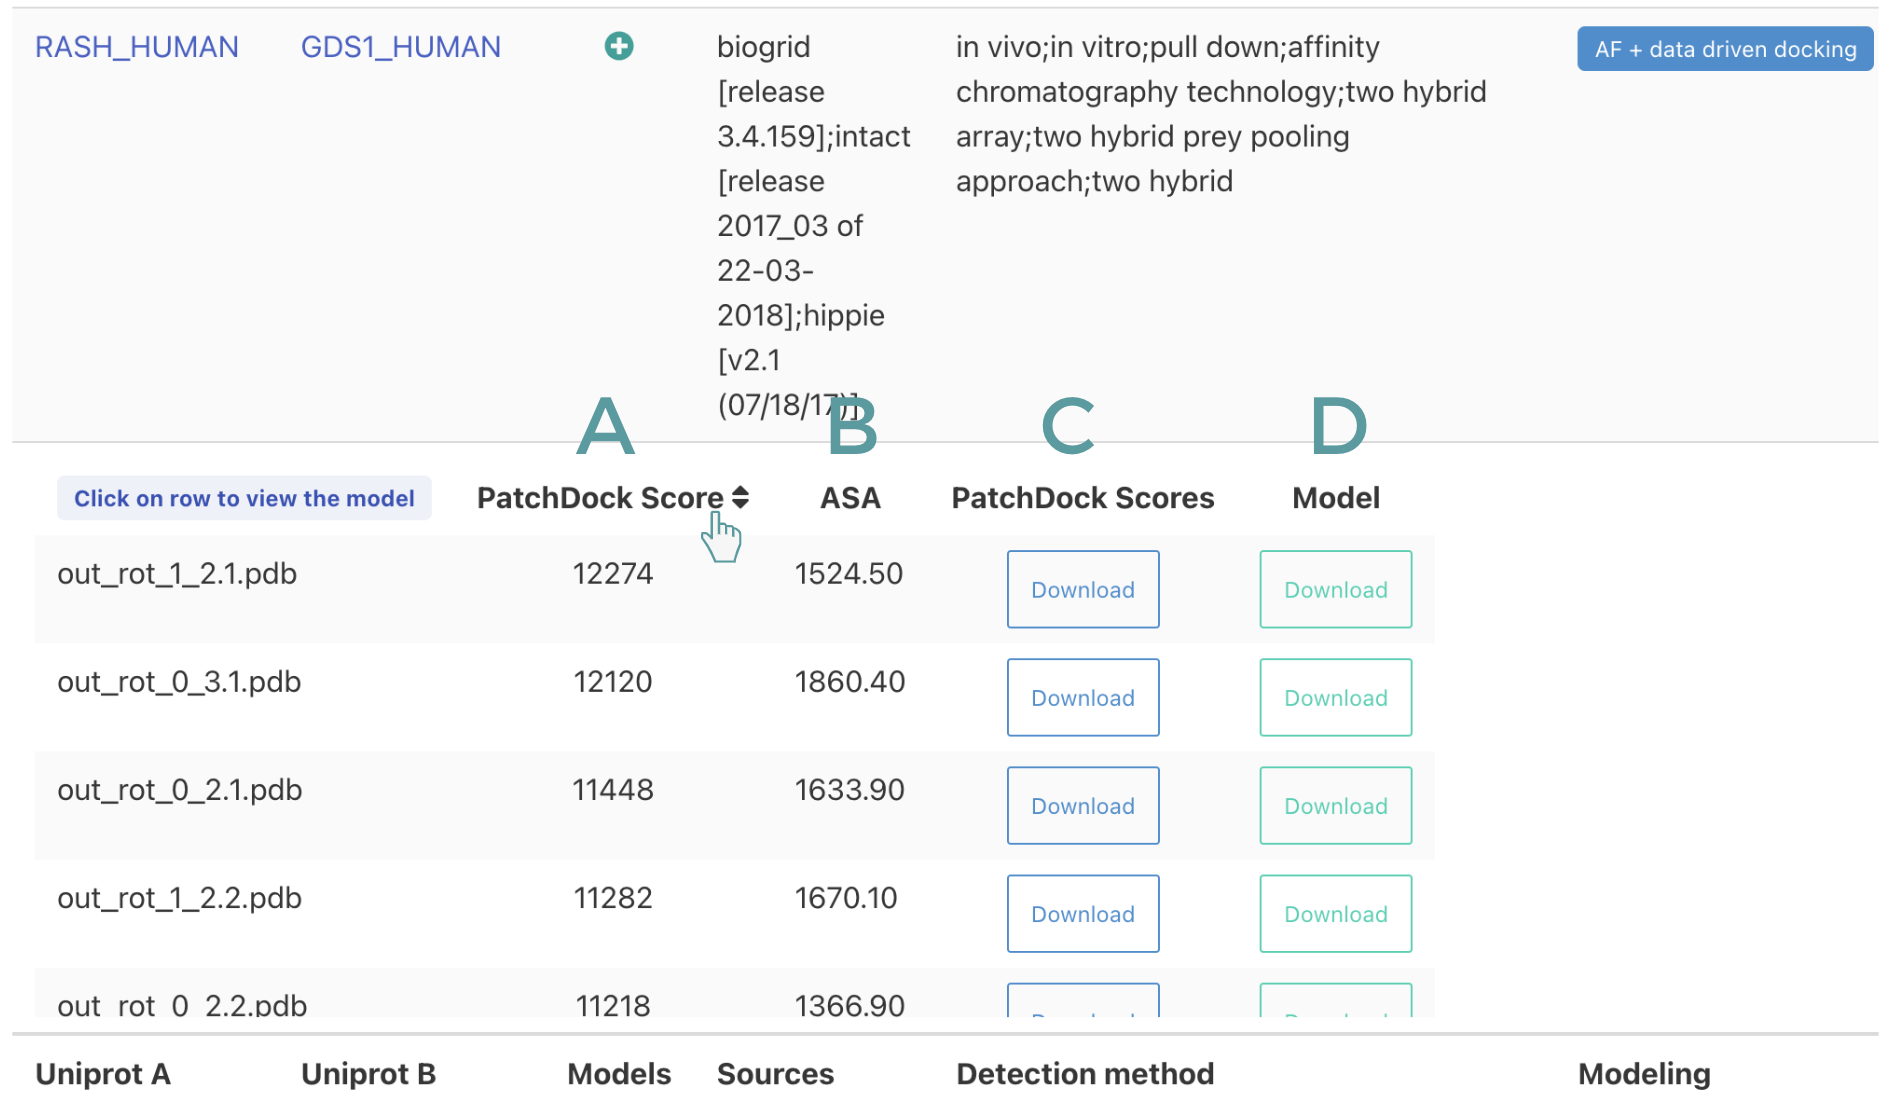
- Docking If the complex was modelled by docking, the table contains information on the PatchDock score: column A, the total surface of the interface in Ang 2 : column B. Users have the option to download the output file of PatchDock: column C and the coordinates of the complex: column D.
Visualizing complexes
By clicking over the list of models displayed in the table described above, the structure of the complex will be shown in the XX applet implemented in CM2D3. The applet contains a set of embedded functionalities that allow a number of manipulations including selection of residues, chains, changing of colours and representations, calculating distances, snapshots, etc. Of interest also is the option to enlarge the applet to full screen (shown in green circle)